The European Commission's own summary is blunt: since 2013, house prices in nominal terms have risen by more than 60 per cent across the EU, growing faster than household income. Go back further and the number is worse. Prices have nearly tripled since 2000.
The usual next move is to put that beside a wage series, watch the two lines separate, and call the gap a mystery or a swindle. It is neither. The comparison is simply measuring the wrong thing, because a house does not sell for what the average person earns. It sells for what the highest bidder can raise, and by 2021 what a bidder could raise had very little to do with a payslip.
First, an honest correction to the comparison
The 60 per cent figure is nominal and it is measured from the bottom of a crash, which flatters it. It does not mean incomes stood still.
On the Commission's price-to-income series, the EU as a whole deteriorated by roughly a tenth over the decade, with the gap opening after 2016, widening sharply through the pandemic, then narrowing a little after 2022 as pay rose and prices stalled. So a rough shape: if prices went from 100 to 160 while the ratio worsened by about 10 per cent, income went from 100 to something near 145.
Two things stop that being reassuring. Most of that income growth was nominal rather than real, and inflation ate a large share of it. And the EU average hides enormous variation. Commercial trackers put the Netherlands and Portugal above 130 on a 2015 base, meaning price growth outran income growth by more than 30 per cent, while Romania, Cyprus and Finland did far better. For a buyer in Amsterdam the problem is not the European average. It is considerably worse than that.
Still, the honest version of the puzzle is not that prices rose 60 per cent while pay rose nothing. It is that prices outran pay by roughly a tenth in a decade, and by a third in the worst-hit countries, and the question is where the extra bidding power came from.
What a buyer can bid is not what a buyer earns
Start with the largest single answer, which is the mortgage rate.
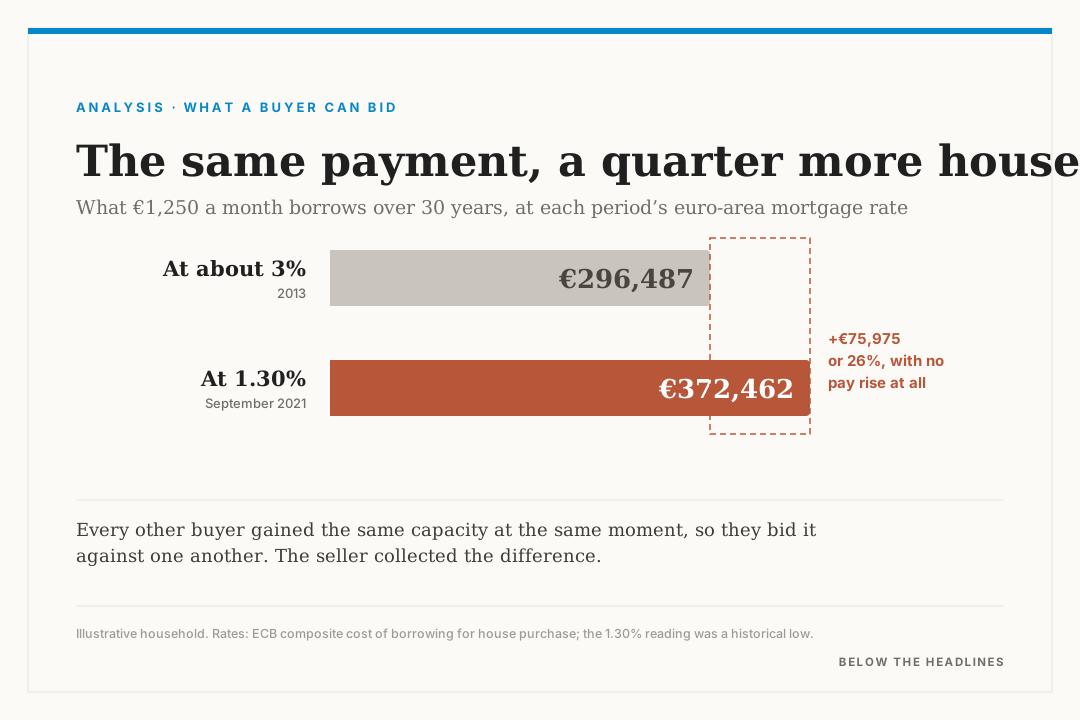
The ECB's composite cost of borrowing for house purchase sat around 3 per cent in 2013. By September 2021 it had fallen to a historical low of 1.3 per cent. That sounds like a technical adjustment. Translate it into what a household can borrow and it stops sounding technical at all.
Take a household that can pay €1,250 a month on a 30-year mortgage. At 3 per cent that payment supports a loan of about €296,000. At 1.3 per cent the same payment, from the same income, supports about €372,000. That is roughly €76,000 of additional purchasing power, a quarter more, arriving without anybody being promoted.
Now the part that matters. Every other buyer at that auction gained the same capacity in the same month. They did not use it to buy the same house more cheaply. They used it to outbid each other, and the seller collected the difference. This is the recurring trap in policy that makes borrowing cheaper: unless the number of houses rises too, cheap money does not buy affordability, it buys a higher clearing price, and the market ends up exactly as unaffordable as it was before.
The ECB has measured the strength of this channel from the other direction. A one percentage point rise in mortgage rates cuts house prices by around 5 per cent after roughly two years. In a low-rate environment the same one point cuts them by about 9 per cent, nearly double. Rates were not just falling during the boom; they were falling in the range where falling matters most.
None of that would have mattered if Europe had built
Cheap credit is a demand story, and demand stories only turn into price stories when supply refuses to move.
This is the structural heart of it. When the price of most things rises sharply, somebody makes more of them. Housing increasingly stopped behaving that way. The Commission finds new supply failed to keep pace with demand throughout the decade while the responsiveness of supply actually deteriorated, with construction near historic lows in many member states and building permits never fully recovering from the financial crisis before falling again after 2022.
Economists put a number on that responsiveness. An elasticity of one means a 10 per cent rise in demand produces roughly 10 per cent more housing. The Commission's own explainer notes that a low elasticity, in the range of 0.1 to 0.3, means supply barely moves when prices climb. Estimates for European markets sit well below the United States, and OECD work puts long-run responsiveness under one for the Netherlands, Belgium, France, Austria, Italy, Germany and Portugal.
So picture the same 10 per cent rise in demand arriving in two cities. In the responsive one it becomes mostly new flats and a little price. In the constrained one it becomes mostly price and a few flats. Europe spent a decade being the second city, and the extra borrowing capacity had nowhere to go except into the price of houses that already existed.
Most of what you are paying for is the ground
There is a sharper way to say this, and it comes from a study of 14 advanced economies over six decades.
Knoll, Schularick and Steger, writing in the American Economic Review, attribute 84 per cent of the rise in house prices between 1950 and 2012 to rising land prices rather than to the cost of building. The Commission cites the finding directly. Bricks, labour and bathrooms are not what got expensive over the long run. The ground did.
Land behaves unlike almost anything else in an economy. Nobody can manufacture more central Amsterdam. You can build upwards, convert offices, redevelop industrial strips and extend a metro line, but zoning and planning decide how much usable residential land actually exists, and those decisions move slowly and often not at all.
The consequence is uncomfortable. When a city becomes more productive, when better jobs arrive and wages rise, the gain does not stay with the people earning it. More people want to live there, the number of homes does not rise in proportion, and the improvement is capitalised into land values. Whoever already owned the ground collects a share of everybody else's pay rise. That is a large part of how prices climb faster than the wages of the people paying them.
Population is the wrong number to be looking at
A common objection at this point is that Europe is barely growing, so there cannot be a shortage. The objection uses the wrong denominator. Housing is demanded one dwelling at a time by households, and the number of households has been climbing far faster than the number of people in them.
The same people, spread across more homes
The number of households grew more than five times faster than the population. People keep living in smaller groups, and each step down means the same number of people need more homes.

Between 2010 and 2024 the number of EU households grew by 10.34 per cent while the population grew by 1.96 per cent. Divorce, later marriage, longer lives, widowhood, fewer multigenerational homes and young adults finally moving out all raise the number of front doors required without raising the number of people behind them.
The arithmetic is quick. A hundred people living 2.5 to a home need 40 homes. The same hundred living 2.2 to a home need 45. Nobody was born, and demand rose 12 per cent.
Demand also refused to spread out. Urbanisation continued and jobs concentrated in a shrinking number of productive metropolitan regions, so an empty house in rural Italy does nothing for a nurse in Amsterdam. Migration compounded this, and the Commission's cross-country work finds a stronger relationship between net migration and real house prices than between natural population growth and prices. That makes sense: a baby needs a bedroom in twenty years, while a worker arriving on Tuesday needs one on Tuesday.
The bidders who were never on a salary
Here is where the wage comparison finally breaks altogether.
Take two buyers, each earning €60,000. One has €20,000 saved. The other has €150,000 of equity from a house they already own and €50,000 from family. Their incomes are identical and their bids are not remotely comparable. As prices rise, existing owners accumulate more equity, which they carry into their next purchase, which pushes prices further. Rising prices manufacture the purchasing power that raises prices again, and the people locked out of that loop are the ones who have only a salary.
Then there are buyers who are not households at all. A pension fund or a listed landlord does not consult the local median wage; it prices expected rent against expected appreciation and the cost of finance. Institutional participation in European residential property has grown markedly, and the Commission's own assessment of what that did is worth quoting: their increased presence in major cities may have contributed to price-to-income ratios deviating from long-term trends, weakening the link between local housing markets and the underlying economic and demographic fundamentals.
That sentence is the answer to the question this article started with, written by the institution that produced the 60 per cent figure. Prices came loose from local wages partly because a growing share of the bidding was never done with local wages.
Governments kept adding money to a market that could not add houses
Meanwhile the tax system was pushing in the same direction.
Decades of policy across Europe has tried to make ownership easier through mortgage interest deductions, buyer subsidies, guarantees and preferential treatment of owner-occupied housing. In a market where supply can respond, that helps people buy. In a market where supply cannot respond, it is simply more money chasing the same houses, and it ends up in the price. The Commission states this directly, identifying favourable tax treatment as inflating prices where supply is inelastic and singling out mortgage interest relief for encouraging heavier borrowing. The OECD reaches the same conclusion.
The Netherlands is the clearest case, having combined generous mortgage interest deductibility with unusually high household leverage, rapid household formation, concentrated urban demand and very inelastic supply. Which is why it sits near the top of every deterioration table rather than near the average.
Then the pandemic arrived on top of all of it
The conditions were already in place by 2019. What happened next was an extraordinary demand shock landing precisely when supply was least able to answer.
Households that kept their jobs accumulated savings because there was nothing to spend them on. Governments protected incomes. Mortgage rates reached that 1.3 per cent low. People decided they wanted another bedroom or a garden or somewhere to work. Investors, facing almost no yield anywhere else, looked at residential property. At the same time building sites shut, workers were unavailable and materials became scarce and expensive.
EU house prices rose about 8 per cent in 2021 and about 8 per cent again in 2022. Two years account for a large share of the decade's increase.
The construction industry then proved unable to catch up. The Commission finds construction beset by low technological integration, limited research spending and declining productivity, with costs driven up by materials, supply chain disruption and energy. Labour shortages have become acute. The market was signalling as loudly as a market can that houses were valuable and more should be built, and the sector's capacity to answer was weaker than it had been in a generation.
The tell is in the rents
One last piece of evidence, and it is the one that settles what kind of boom this was.
Average EU rents rose nowhere near as fast as purchase prices. If this had been a straightforward story about people becoming much richer and buying more housing, the two would have moved closer together. They did not.
Some of that is measurement, since official rent indices are weighted towards existing tenancies where increases are often capped, while rents on new contracts rose far more steeply. But the divergence still tells you something real. The price of housing as an asset rose faster than the price of housing as shelter, which is what happens when cheap finance, expected appreciation, tax advantages and investment demand are doing much of the work.
Which brings the answer back to a single sentence. Prices did not rise 60 per cent because Europeans got 60 per cent richer. They rose because the amount of money able to chase a home increased a great deal faster than the number of homes, and in a market where the ground cannot be manufactured, extra money has only one place to go.
This is the layer below the headline.
Sources
Every figure in this piece traces back to a published document or report. Follow them.
- Understanding the housing crisis, SWD(2025) 1053/2, Part 1/2European Commission, 16 December 2025, accompanying the European Affordable Housing Plan
- The impact of rising mortgage rates on the euro area housing marketECB Economic Bulletin, Issue 6/2022
- Composite cost of borrowing indicatorsEuropean Central Bank
- No Price Like Home: Global House Prices, 1870–2012Knoll, Schularick and Steger, American Economic Review 107(2)
- Institutional investors and house prices, Working Paper 3026European Central Bank
- Developments in the recent euro area house price cycleECB Economic Bulletin, Issue 2/2025
- Housing in Europe, 2025 editionEurostat
- Housing prices (HM1.2)OECD Affordable Housing Database
- Place-based determinants of housing prices in EuropeEuropean Commission Joint Research Centre